Fun With Discord.py And Matplotlib
August 14, 2019 - Griffin Gore
Today I finally finished the Codecademy Python course, and I decided that I should make something actually useful to try out my newfound Python skills, so I decided that making a Discord bot using Discord.py would be a project simple enough for me to understand, but that I could make as complex as I wanted with my knowledge of Python (and maybe add to later if I learned anything cool that’s relevant to Discord bots).
So I loaded up PyCharm and started up a new project with the Discord.py library. After reading the documentation, I started making some commands. At first I thought I was going to be limited to only outputting strings, which does have a lot of cool uses, and most Discord chat-bot commands do just output text, but what if I wanted to output more complex data?
Well after some more research in the Discord.py Docs, I discovered something rather powerful in the send() method arguments, the file argument. This unlocks a lot of new possibilities and functionality from a Discord bot, and the first thing I thought of, being the data nerd I am, was to generate graphs using Matplotlib.
Now I initially created a bar graph based on the numbers that the user inputs, but I ran into a few problems at first, but luckily it was mostly easy to fix errors with the way I was using the Discord.py send(file) argument. It turns out that ctx.send(file="test.png") doesn’t actually work, and instead you have to use the discord.File("test.png"), then set file equal to that. The other issue I ran into0 was much simpler, in that I forgot to clear the plot after saving the image, so Matplotlib just kept appending data on top of the already exiting data, but all it took was a simple plt.close() 😂.
As for future plans for this concept, I might end up turing it into a whole bot based around the concept, with much more advanced options for the graphs, and obviously a method of making it work for multiple users at once. I don’t know how popular it would be, but I think it would be a cool thing to make, and definitely a way to practice my programming skills. I’ll make sure to share any other cool advancements/discoveries I make here, but for now, here’s the code I used to make the bar chart, if you want to add it to a bot of your own:
@bot.command()
async def plot_test(ctx, *args):
    x = args
    image = discord.File("test.png")
    plt.bar(np.arange(len(x)), x)
    plt.savefig("test.png")
    plt.close()
    await ctx.send(file=image)
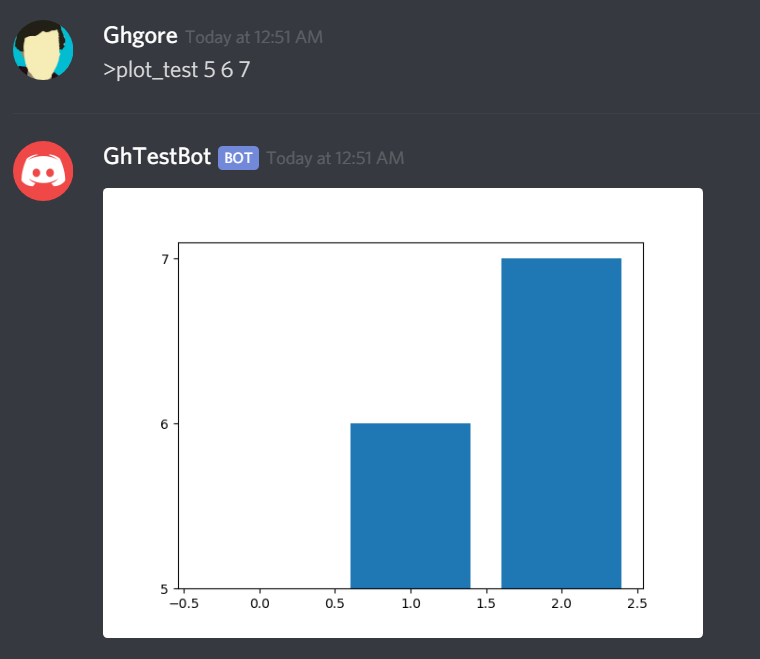
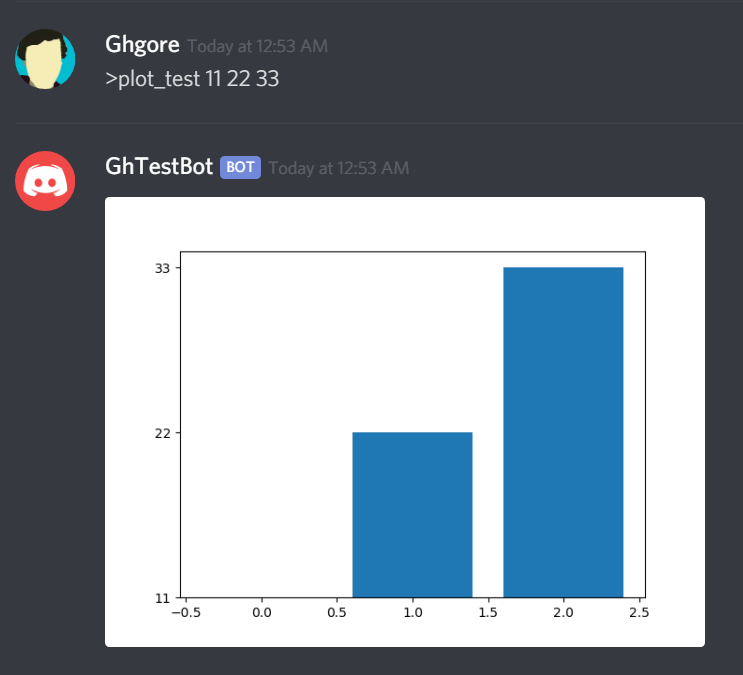
Oh, and some screenshots of it in action: